Part 1 of 2 - Measuring engineering in the age of agents#
At a company where I worked, someone proposed using token consumption as one of the indicators for tracking LLMs' impact on developer productivity. The executive's reasoning started with data already available: the provider allowed consumption tracking by user and team, and the organization also wanted to understand whether AI tools were actually becoming part of the development flow. Users or departments with higher consumption would have to demonstrate the gains they were obtaining from that use.
The proposal combined two different things: adoption telemetry and proof of outcomes. Consumption helped show usage intensity, but once productivity entered the discussion, we needed to observe what happened afterward. A team could consume far more tokens without necessarily delivering faster, reducing rework, or maintaining the same quality.
There are several reasons for this difference. Consumption may grow because more people adopted the tool, tasks became more complex, the submitted context grew, the agent started making more tool calls, or it needed more attempts to complete the same task. It may also grow simply because an architecture became less efficient. Volume alone does not tell us how much useful software reached production, how much time was saved across the complete flow, or what happened to quality and stability.
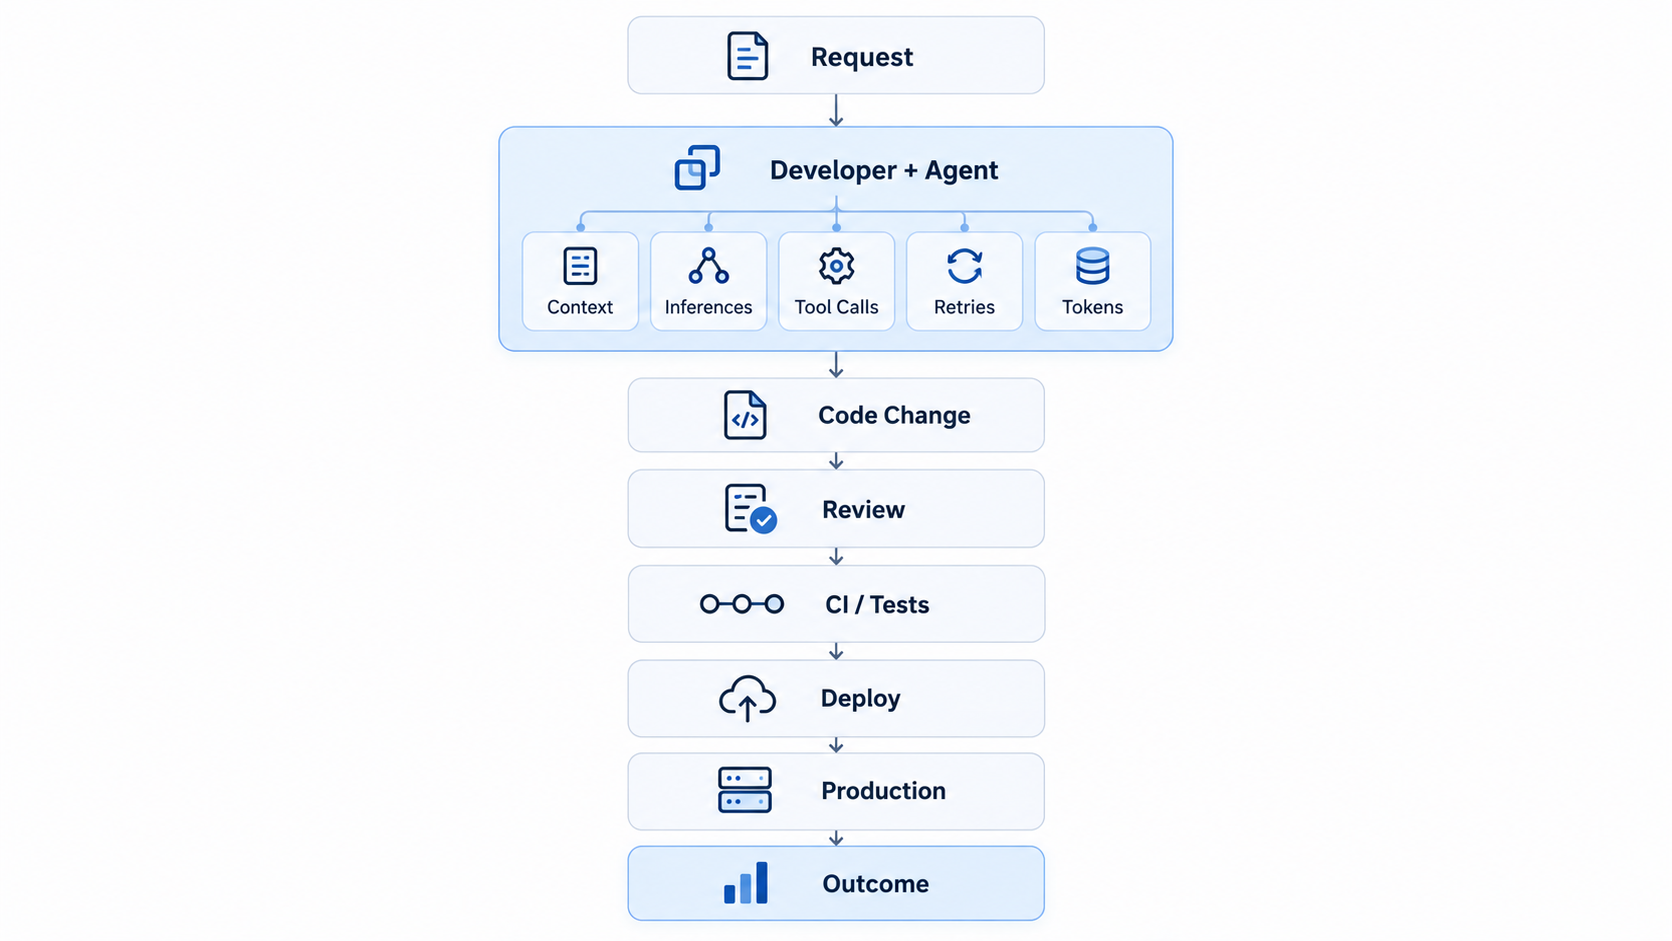
This became even more important with the evolution of coding agents and iterative execution cycles. Between a developer's request and a code change, the agent may search the repository, open files, retrieve context, consult documentation, run commands, test hypotheses, call tools, review its own output, and repeat part of that process. Each step can increase consumption before the change even enters review, CI, or production.
Token usage is therefore relevant data for analyzing that execution. The question is which conclusions we can support from it.
Consider two developers working on comparable changes.
The first uses an agent that receives a large portion of the repository as context, traverses several files, performs twelve analysis-and-correction cycles, and consumes 8 million tokens. The second uses more selective context retrieval, reaches a solution in three cycles, and consumes 1.5 million. Both changes pass tests and are accepted in review.
We still know little about productivity.
The second flow looks more computationally efficient, but perhaps the tasks were not genuinely equivalent. We also do not know how much human time was needed, how long each PR remained in review, whether there was later rework, or whether either change caused a production incident.
The problem becomes more apparent if we draw where the metric is being observed.
 Enlarge ↗
Token consumption appears early in the flow; the result we associate with productivity emerges after several other stages.
This does not make inference telemetry less important. It answers a narrower set of questions: how much we consume, which workloads cost more, how usage is distributed, and where particular architectures are spending more resources.
The same task can produce very different consumption profiles#
Token volume varies for reasons not necessarily related to the amount of value produced. Context window, caching, model, retrieval strategy, number of steps, and agent architecture change consumption substantially.
One workflow may use a single large call. Another may decompose the same task among planner, coder, and reviewer. A third may run an evaluator after every change. With retries, the three profiles diverge even further.
I encountered a version of this problem when building the Controlled Autonomy Lab, presented in 6 LLM architecture patterns: lessons from 234 experimental runs on control and autonomy. The lab compares six patterns and records tokens, latency, grounding, execution trajectory, tool use, and other dimensions.
The first runs made it clear that tokens, latency, or a generic quality metric would not be enough to compare the patterns. The evaluation was eventually divided into layers, each addressing a different property of the result.
One result helps show why this matters: in the repeated benchmark, chaining made three sequential calls and exhibited lower specific grounding than the augmented LLM, which used one call, in all three provider bundles observed. I would not treat that result as evidence that more calls worsen quality; the experiment was not designed to prove that mechanism. What it showed was that call count did not have a monotonic relationship with grounding in that set of runs.
The implication for productivity is similar. Two agents may consume very different amounts of inference and reach similar results. Consumption alone does not show which configuration contributed more to the engineering flow.
When utilization becomes a target#
The situation changes when token usage stops being just telemetry and begins influencing targets, rankings, or performance evaluations.
In August 2026, Google Cloud published a piece about tokenmaxxing, a term describing the idea that increasing token consumption would, by itself, lead to better AI results. The argument is that consumption must be related to the outcome obtained and workflow efficiency, rather than maximized in isolation. What sports cars can teach us about optimizing AI token spend.
I had already addressed this phenomenon from another angle in The AI bill has arrived: is limiting usage the answer? That piece focused on cost and architecture. Some companies even experimented with internal consumption rankings to encourage adoption and then encountered incentives for artificial consumption.
The incentive is relatively easy to understand. If an organization starts valuing users who consume more tokens, several decisions can increase that indicator without necessarily improving the work: sending more context, keeping responses longer, running more iterations, using larger models, or simply taking more tasks to the agent.
There is also a less obvious effect. A developer who improves the harness, retrieves only the necessary context, uses caching, and reduces retries may greatly decrease consumption for the same class of task. If the company interprets volume as productivity, an efficiency improvement may appear in the dashboard as declining performance.
Where tokens are useful#
There are several cases where I would track tokens closely.
The first is cost: combining consumption with model pricing, caching, and workload type makes it possible to track costs per application, agent, team, or capability and identify meaningful changes after an architectural modification.
The second is adoption: if a tool was made available to 300 developers and only 20 show recurring use, there is a concrete question to investigate. It may concern training, a poor experience, weak use cases, integration difficulties, or simply limited usefulness for that group.
The third is diagnosis: abrupt changes in a workflow's consumption may indicate loops, context growth, caching degradation, new tool calls, or changes in agent behavior.
Tokens can also contribute to efficiency analyses when there is a well-defined outcome. Cost per completed task, cost per successful run, or cost per particular capability allow system versions to be compared with far more context than absolute volume.
This last case appears in Automating eval design and hillclimbing with Claude. In the cost-focused hillclimbing example, the objective is to reduce cost while maintaining or improving performance on a separate evaluation. The final configuration is compared both by its result and by the cost required to achieve it.
This design preserves the objective we want to optimize. Reducing tokens while making the application worse would be a regression; spending more to achieve a material improvement may be justified. Consumption is analyzed alongside a quality measure.
AI exposure is a variable, not the outcome#
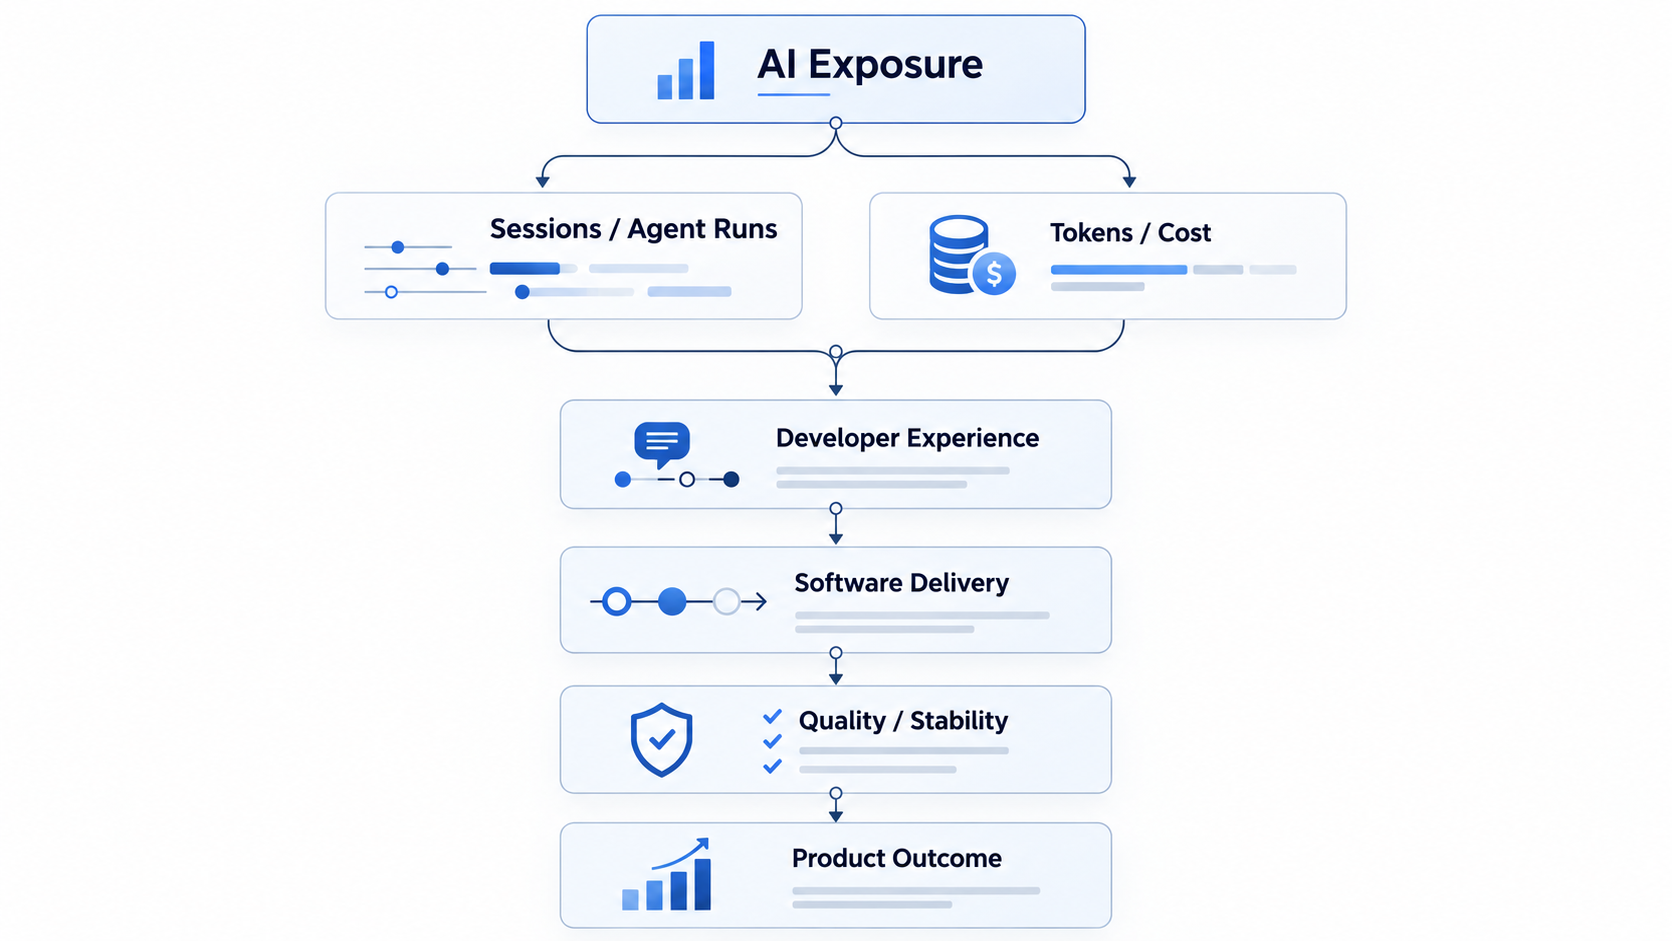
Token usage can serve another function: helping estimate different levels of AI exposure.
In a productivity study, I would not classify that exposure solely by consumed volume. Sessions, active days, agent runs, task types, capabilities used, and usage frequency help distinguish someone using the agent daily for short tasks from someone consuming millions of tokens in a few long runs.
 Enlarge ↗
Even so, greater exposure does not prove AI caused a better result. More experienced developers may be the first to adopt the tool, some teams may work on newer systems, and pipeline maturity may vary considerably between groups.
Even with those limitations, this separation addresses an important problem: it avoids using the exposure variable itself as the experiment's outcome.
From telemetry to the question that really matters#
A company may have nearly all its developers active in a tool, billions of tokens consumed, and thousands of sessions per week. Those numbers demonstrate adoption, but we still need to know what changed in the work.
This is where I would stop interpreting token usage. From here, analysis needs to examine other dimensions: developer experience, the flow into production, stability, and, where there is a clear connection, product outcomes.
This shift also changes the question's design. Instead of “who consumed more?”, what matters is whether groups with different exposure levels showed different changes over time and whether those changes remain visible after controlling for factors such as seniority, task type, application, and pipeline maturity.
Part 2: DORA, Developer Experience, and cohorts: how to compare these changes without turning a single metric into proof of productivity.