Part 2 of 2 - Measuring engineering in the age of agents
In the first part of this series, I separated two questions that often get mixed together: how much teams are using AI, and how much the engineering system improved after that use. Tokens, sessions, agent runs, and cost are very helpful for the first. To answer the second, we need to observe other parts of the flow and compare the change against some reference.
I would start with the hypothesis, not the dashboard.
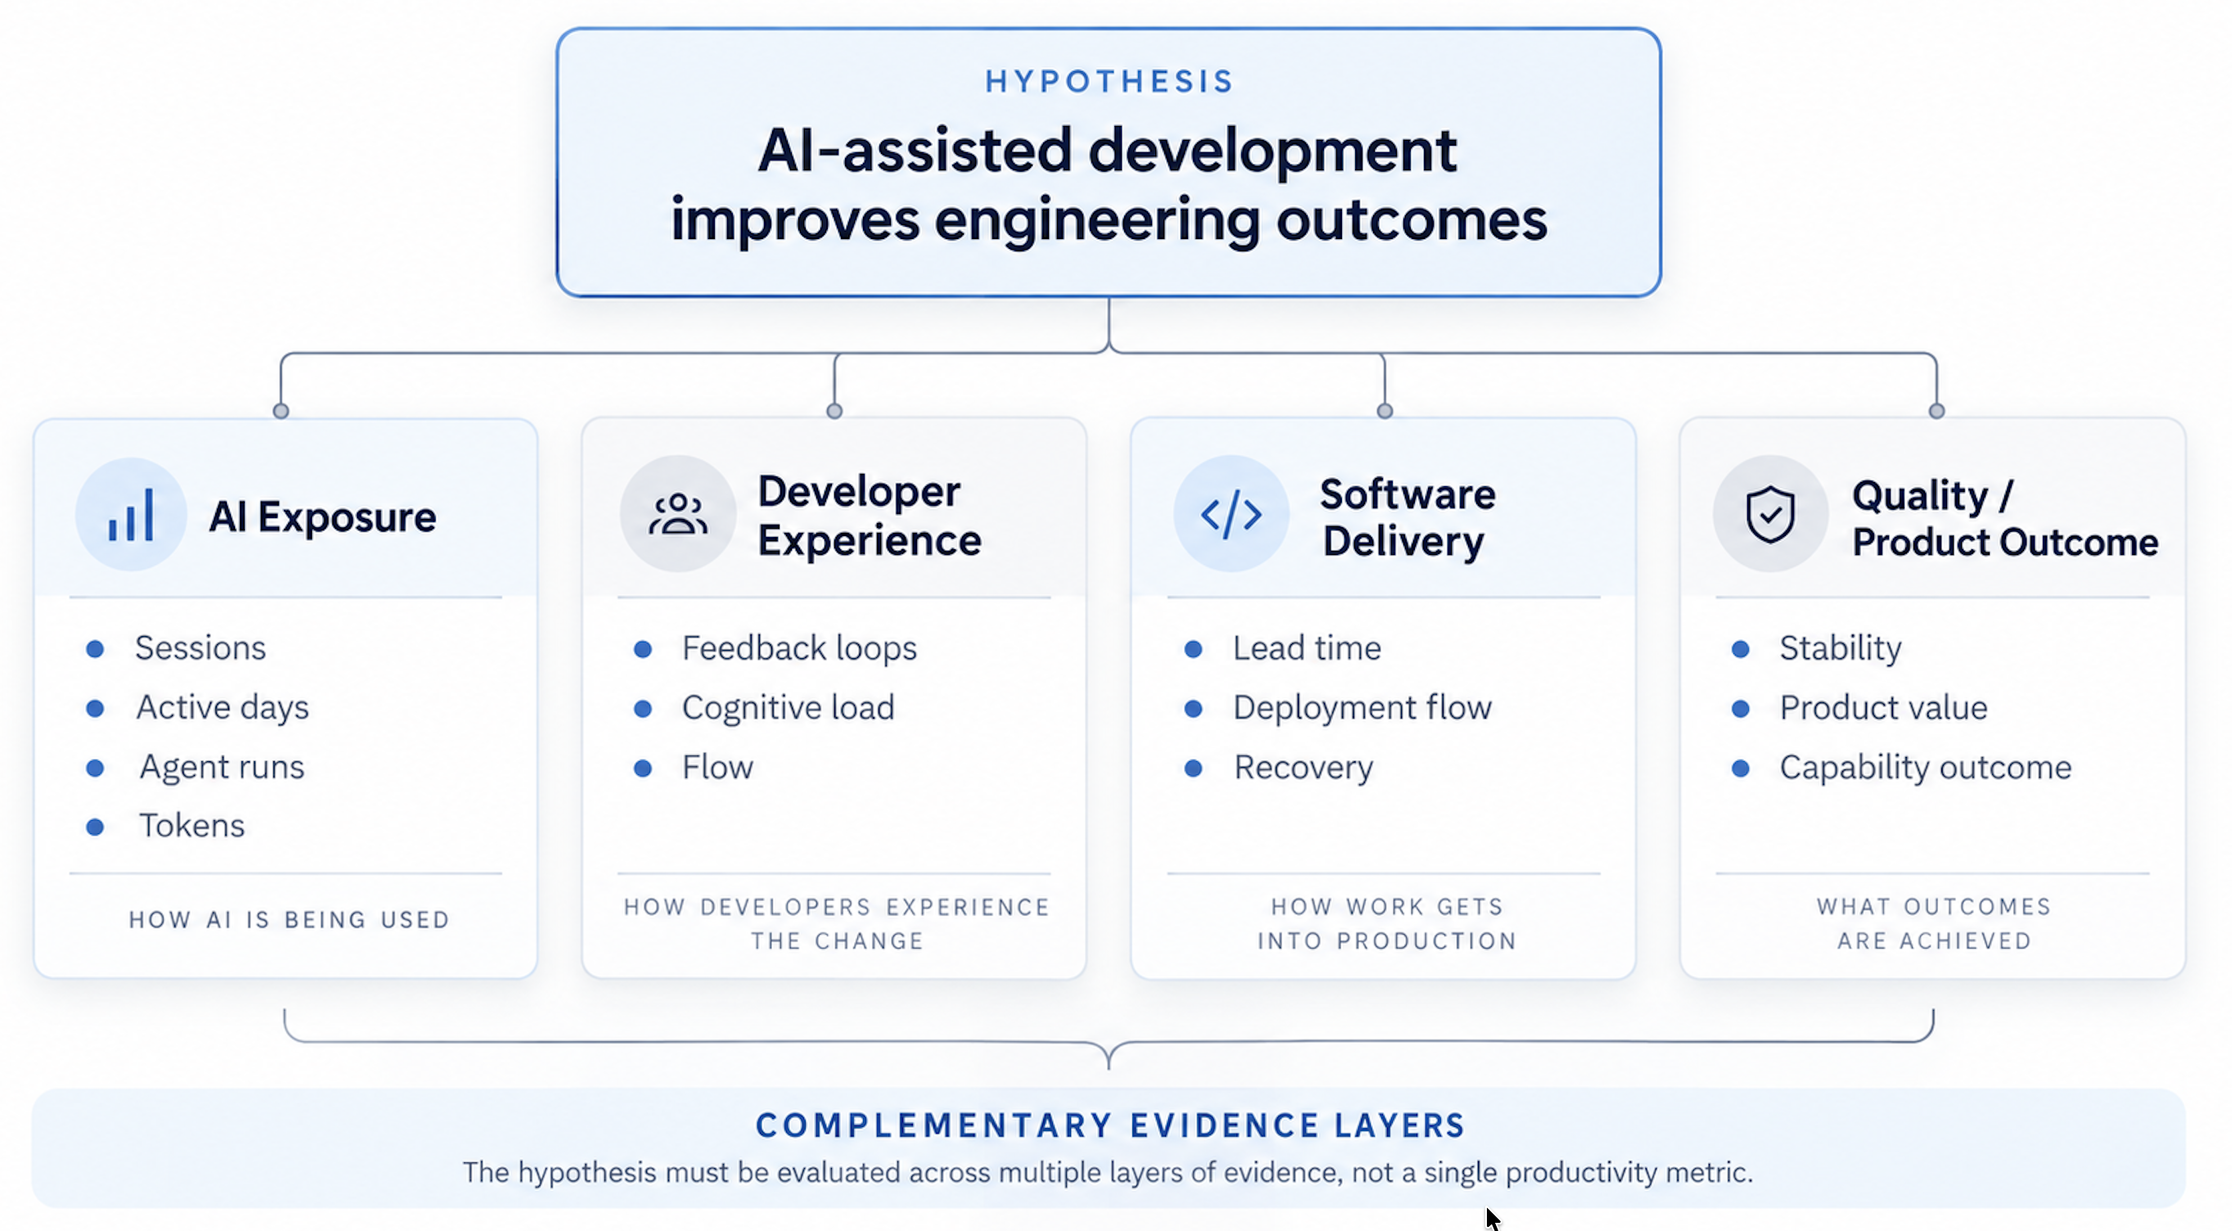
Suppose a company is expanding its use of coding agents and wants to know whether the investment is producing real gains. One possible hypothesis would be: developers with greater exposure to the tool can take changes into production faster, with less friction in their work and no meaningful increase in failures or rework.
That formulation already distributes the analysis across different dimensions. Time to production belongs to the software delivery flow. Friction requires observing the developer experience. Failures and rework must appear as a counterweight to speed. And to estimate whether the difference is associated with AI use, we need to compare groups and periods in a reasonably defensible way.
 Enlarge ↗
DORA observes the flow into production#
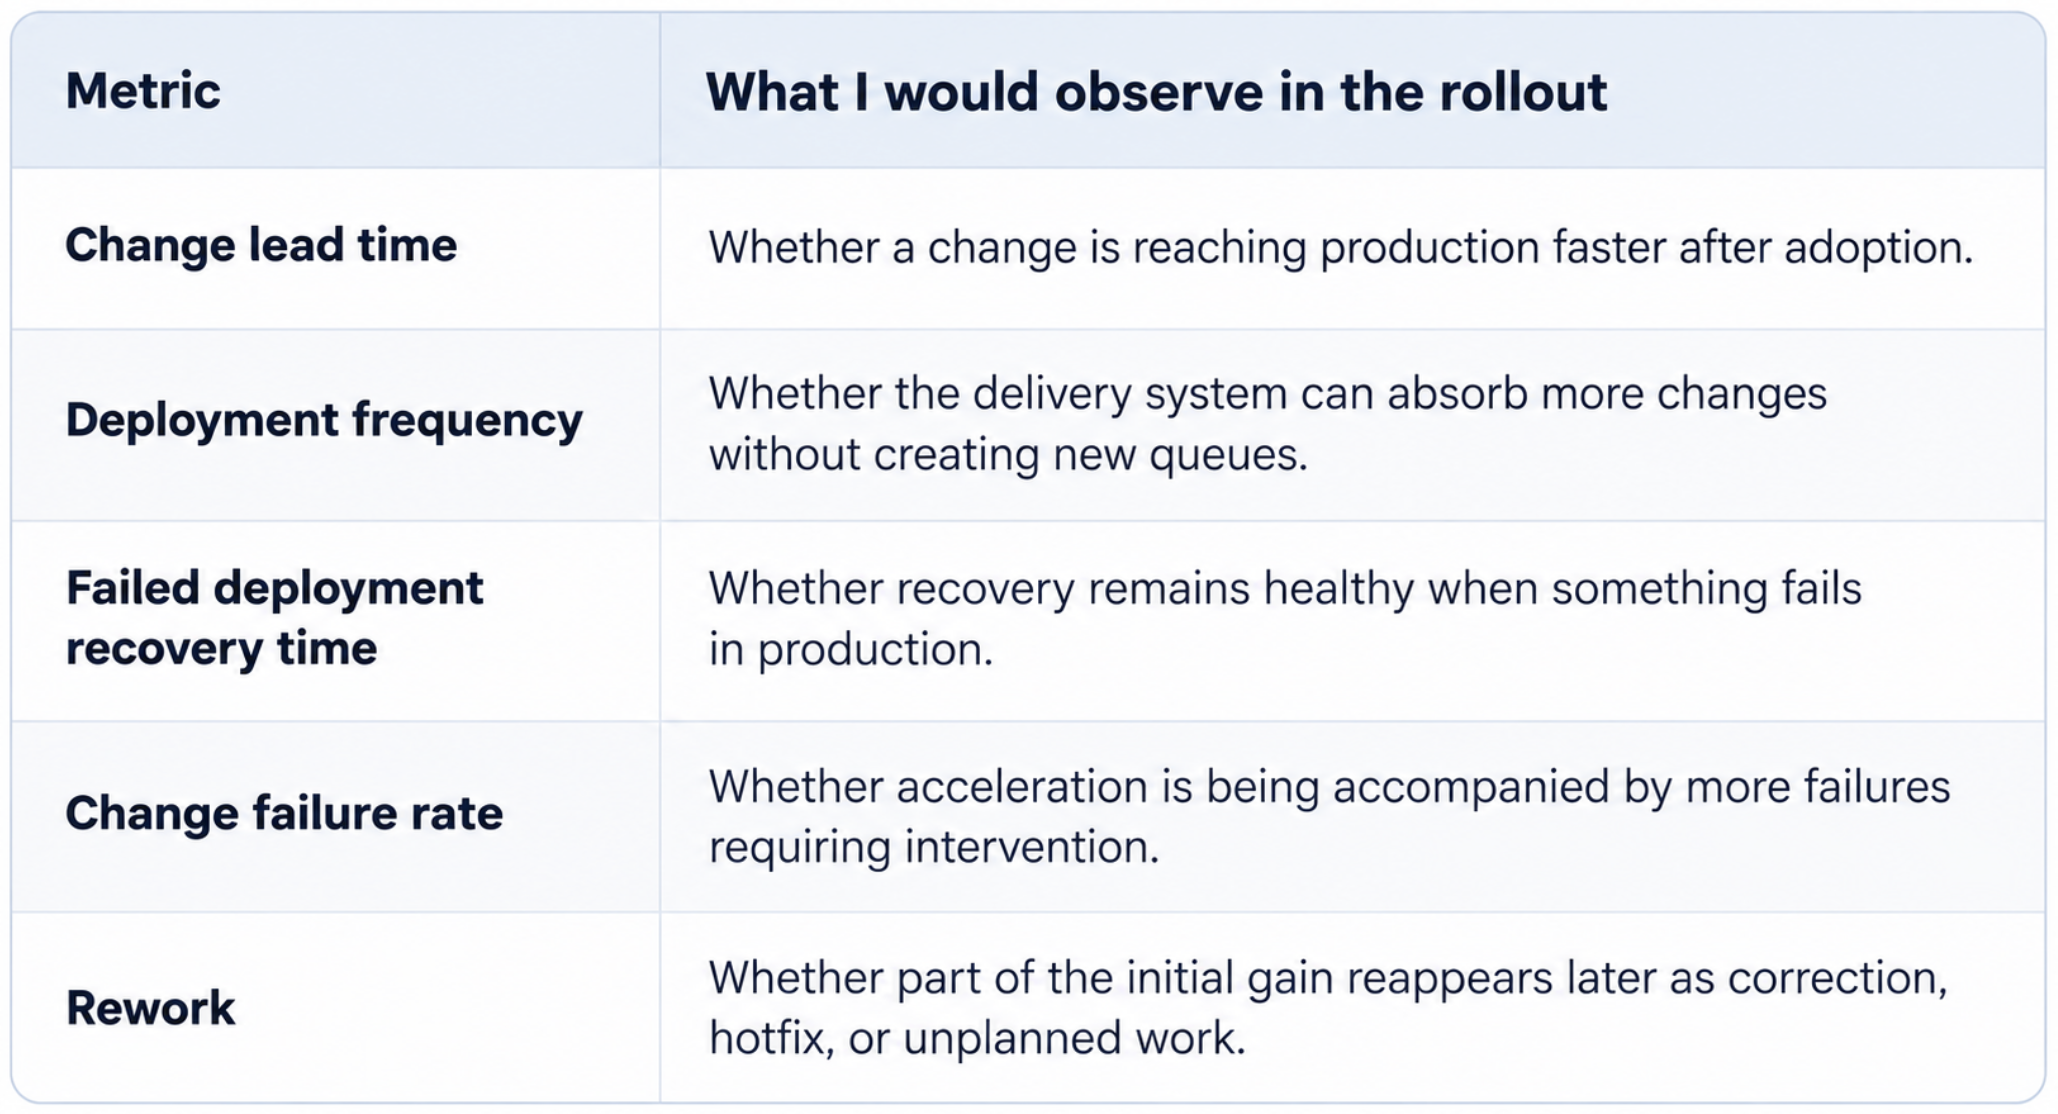
DORA (DevOps Research and Assessment), a research program linked to Google Cloud, is a useful reference for observing software delivery. Today, the discussion includes metrics such as deployment frequency, change lead time, change failure rate, failed deployment recovery time, and rework. A case published by Google Cloud in 2026 about FINRA (the US Financial Industry Regulatory Authority) shows these metrics being adapted to team objectives rather than used as a universal scoreboard. FINRA builds a culture of improvement with DORA and DevOps.
 Enlarge ↗
These metrics are particularly useful because a coding agent may accelerate only the first part of the flow. The developer reaches the PR faster, but review remains congested. The PR enters CI earlier, but the suite is slow or unstable. Generation becomes faster, but security approval retains the same queue. Local time improves while system throughput barely changes.
I would not use DORA to compare individual productivity either. The unit makes more sense at the application, service, or delivery-flow level. Comparing a new service with an automated pipeline against a legacy system subject to external approvals produces differences that say a lot about context and little about AI.
The 2025 DORA State of AI-assisted Software Development report is relevant precisely because it treats AI adoption as a systems problem. Local gains can exist without showing up proportionally in product performance when other constraints remain.
Developer Experience shows what changed in the work#
Some effects may appear before any visible change in deployment frequency or change lead time. An agent may reduce time spent looking for an API, accelerate test creation, or make a repository easier to understand. It may also introduce new friction: outputs requiring extensive validation, long agent runs, constant switching between tool and code, or an increase in the volume reaching review.
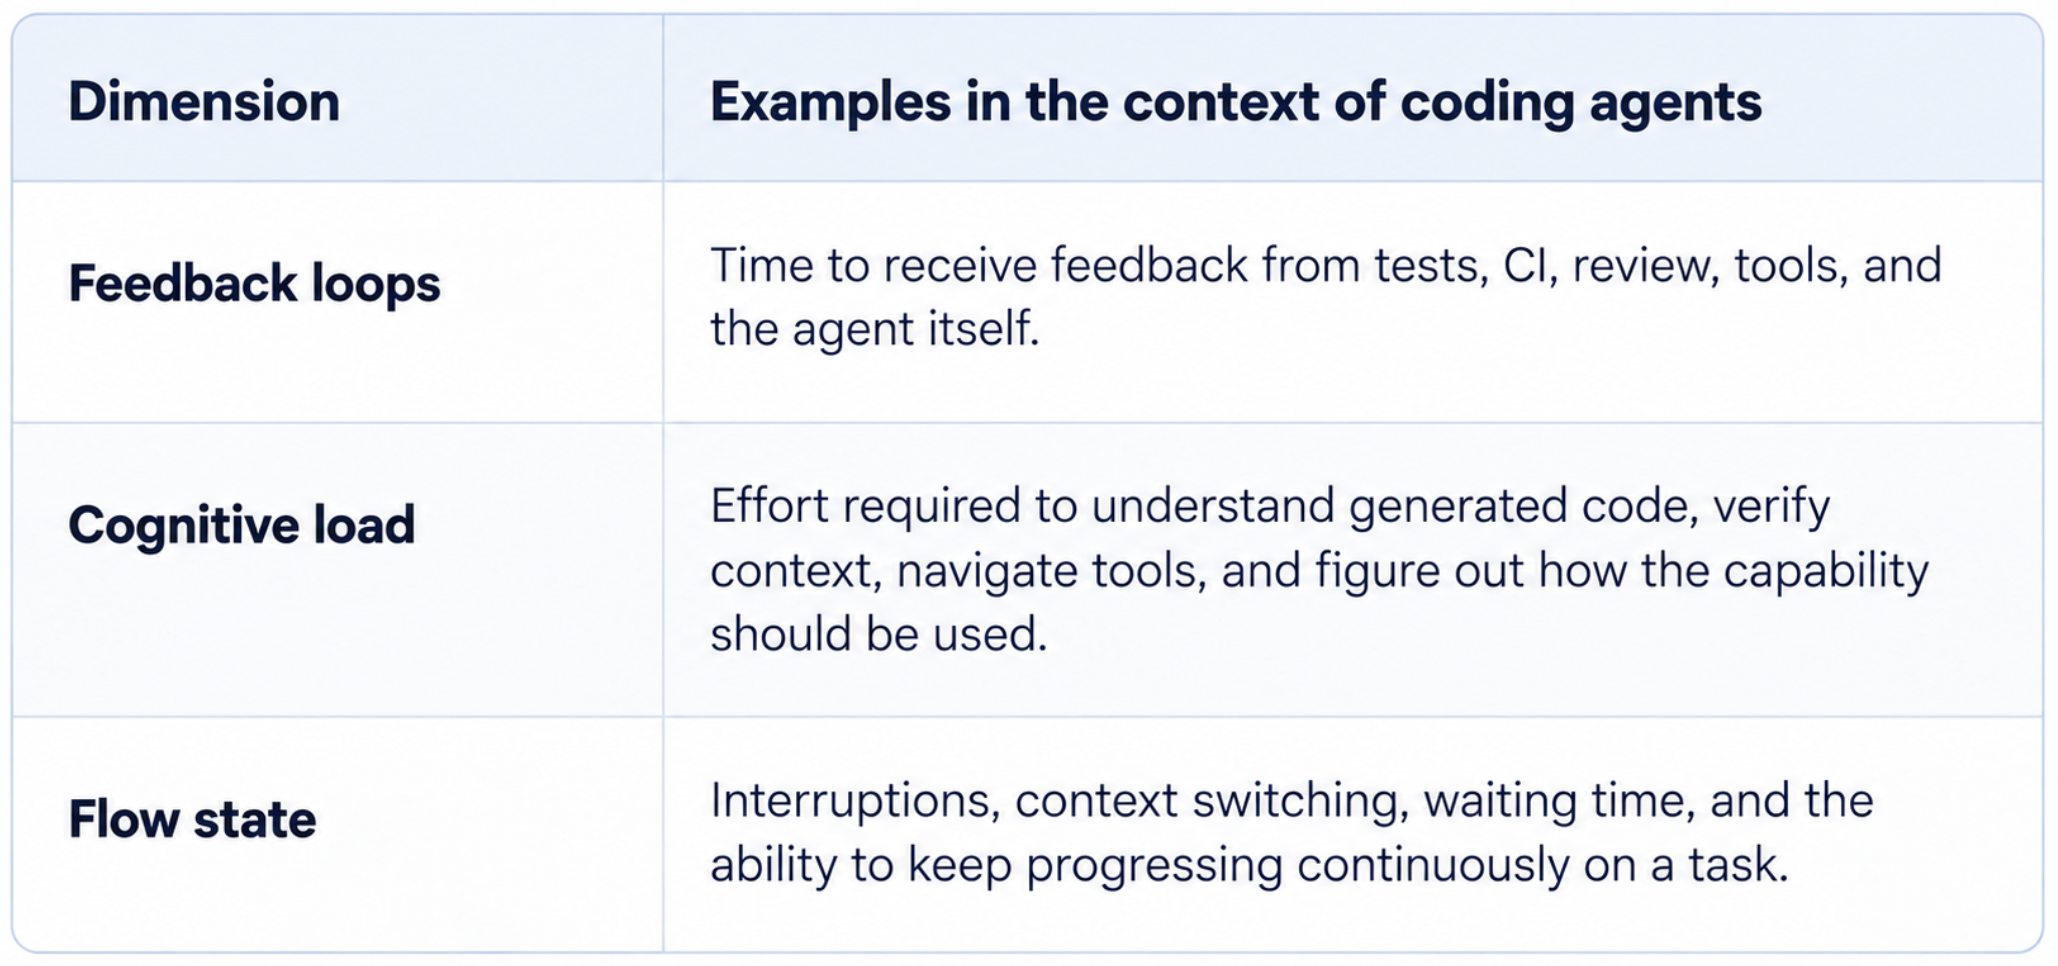
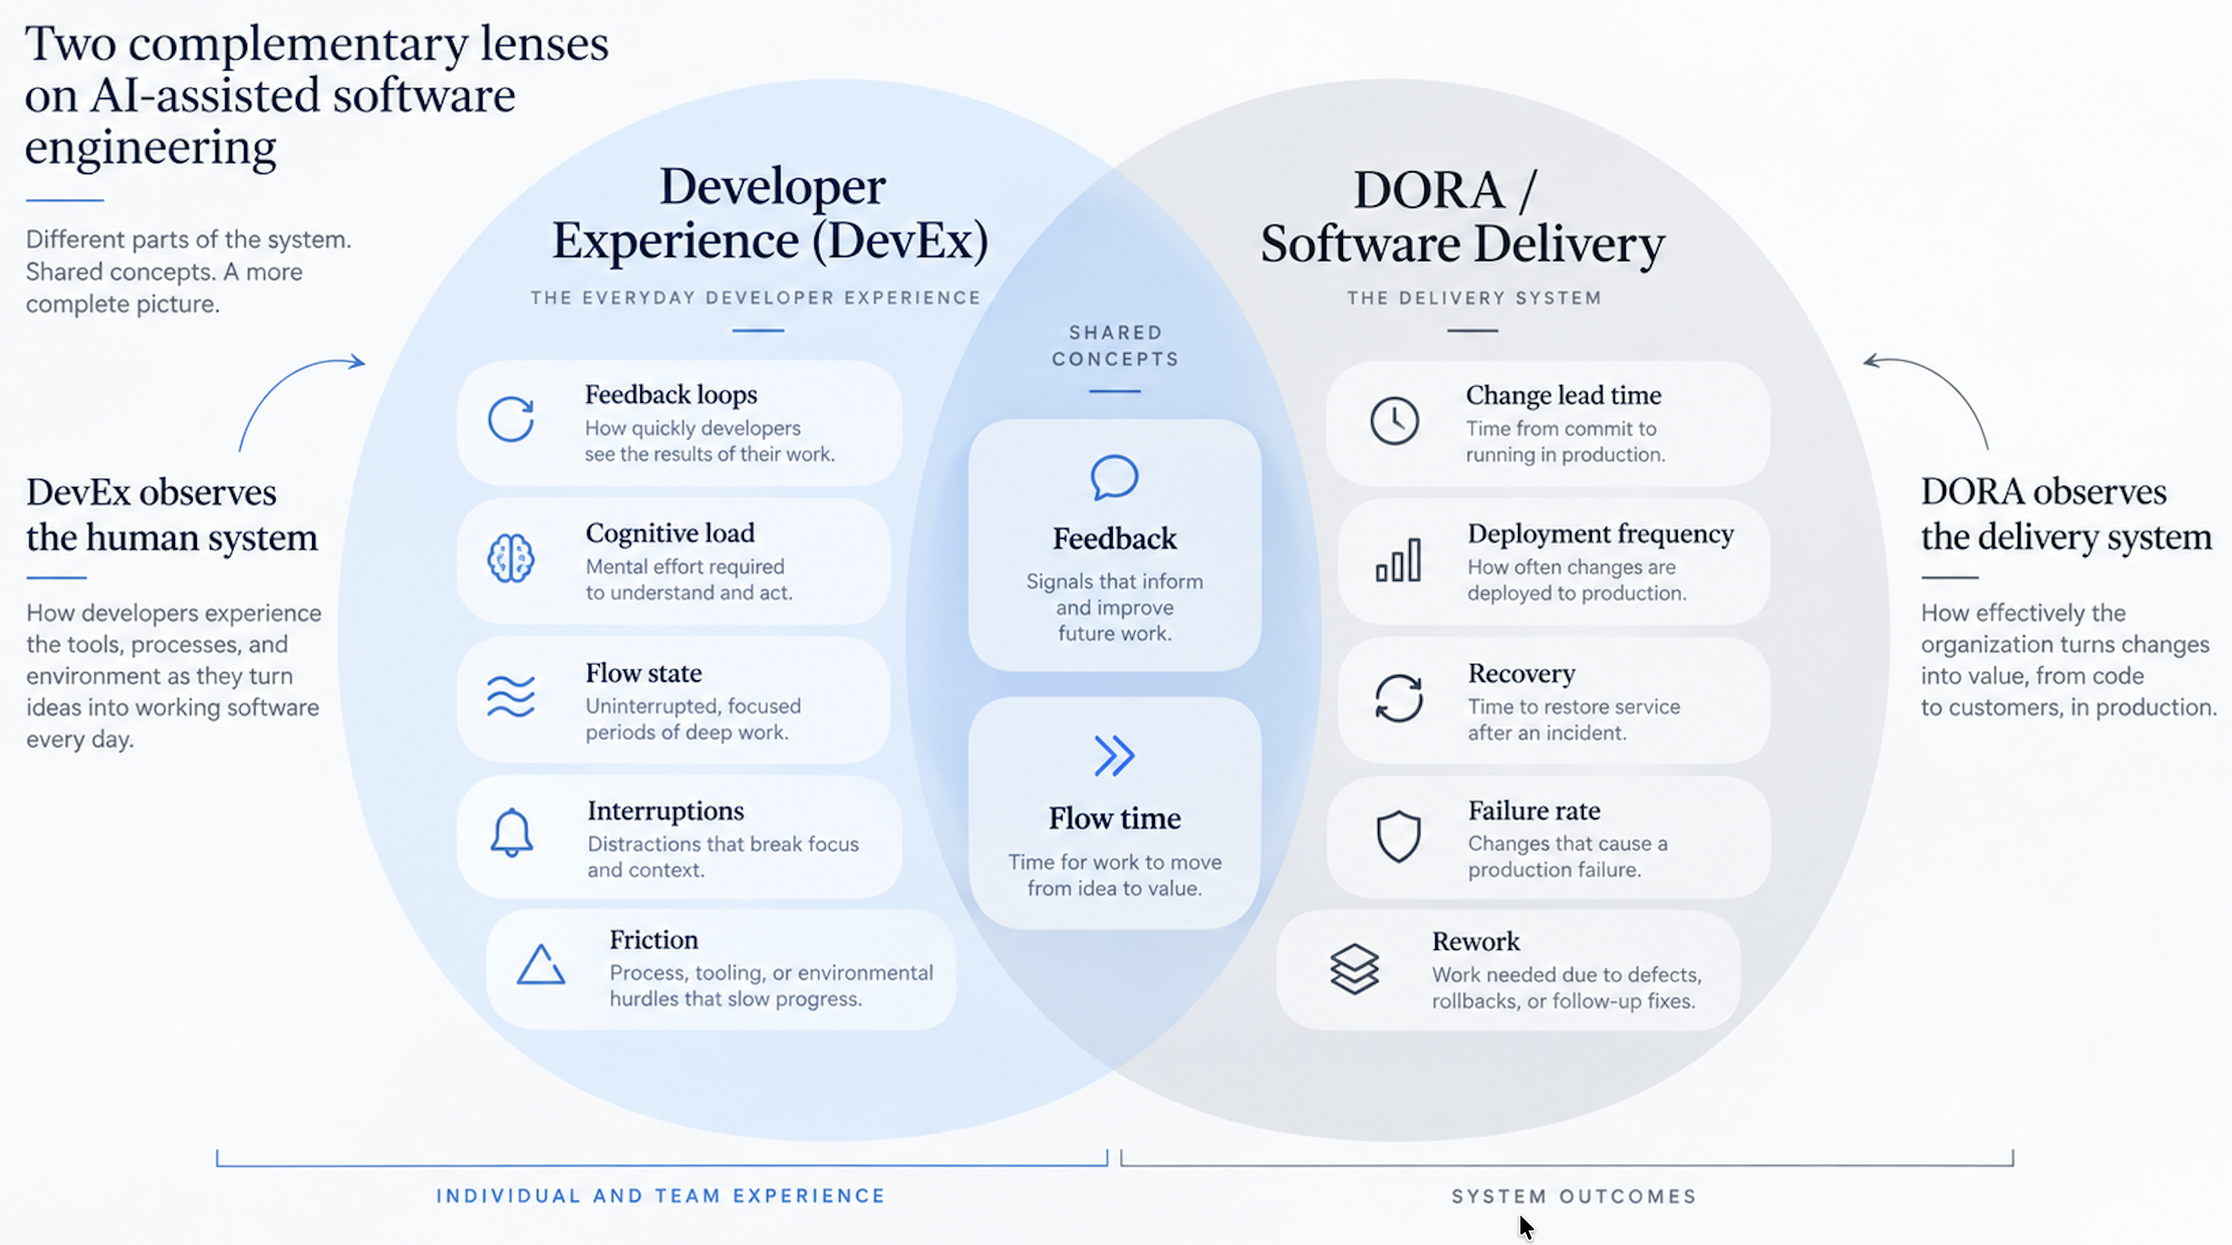
This is why I would place Developer Experience alongside DORA. The framework presented in DevEx: What Actually Drives Productivity organizes that experience into three dimensions well suited to this analysis: feedback loops, cognitive load, and flow state.
 Enlarge ↗
I would combine system data with developer feedback. Surveys alone may capture perceptions while missing objective changes in the flow. Telemetry alone may show times and volumes without explaining why a particular step became a source of friction. The DevEx literature itself proposes combining these two perspectives.
The SPACE framework reaches a compatible conclusion through another route: engineering productivity is multidimensional and should not be reduced to a single metric. For this experiment, I would not need to turn SPACE into another dashboard layer; it mainly serves as a methodological reminder not to confuse activity with productivity. The SPACE of Developer Productivity.
 Enlarge ↗
Cohorts enable comparisons of changes#
DORA and DevEx describe what happened. To study whether AI adoption is associated with a change, we need to compare different conditions.
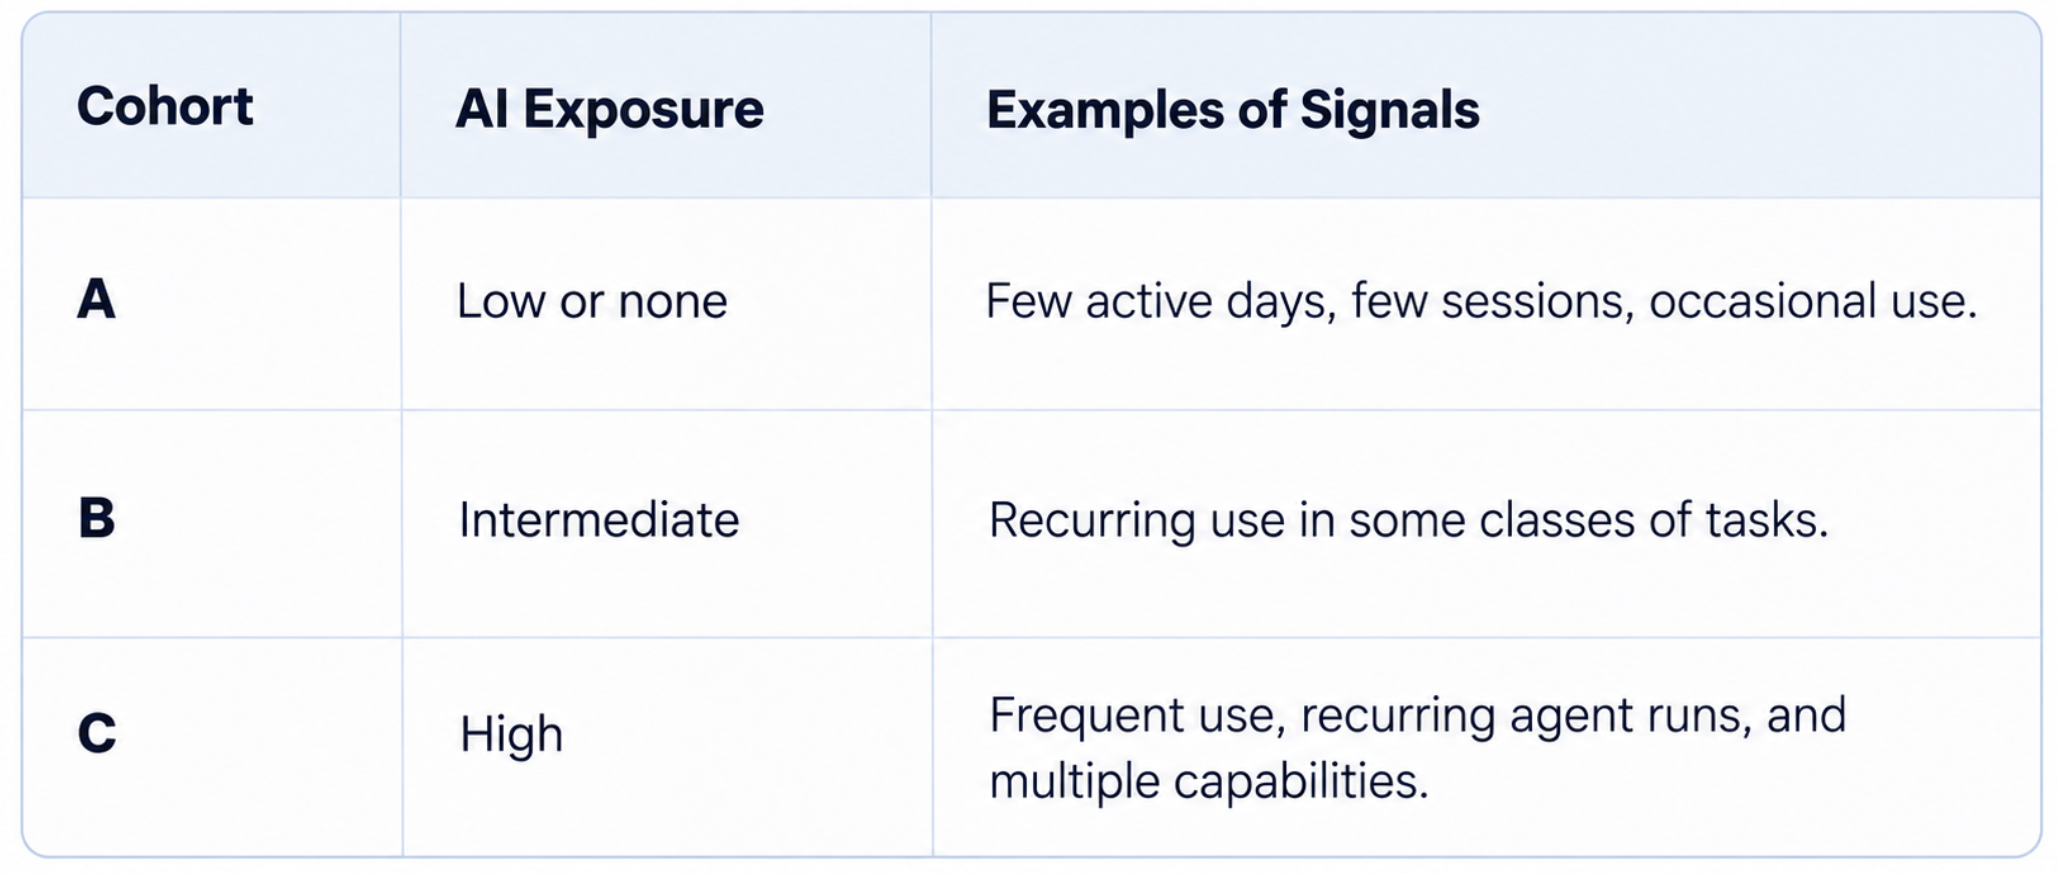
In the first part, I treated AI exposure as a variable rather than an outcome, and that continues here. I would not classify groups only by tokens: I would use a combination of active days, sessions, agent runs, task types, capabilities used, and consumption. This reduces the chance of treating a single very long run as equivalent to recurring use.
An initial segmentation could be simple:
 Enlarge ↗
This classification still needs context. The model, tool, tool availability, harness version, training received, and platform maturity can change the results. I would record those variables alongside the cohorts rather than assume “uses a coding agent” describes exactly the same intervention for everyone.
Keeping a group without AI will not always be possible. A gradual rollout helps: some teams receive the capability before others and temporarily act as a reference. Where operations allow it, randomizing the rollout order strengthens the design. Where they do not, I would try to match groups by domain, seniority, application type, and pipeline maturity.
Before and after is still not enough#
Comparing only the month before and the month after rollout can attribute to AI a change that would have happened without it. The team may have completed a migration, improved CI, reduced the review queue, or entered a period with fewer complex releases.
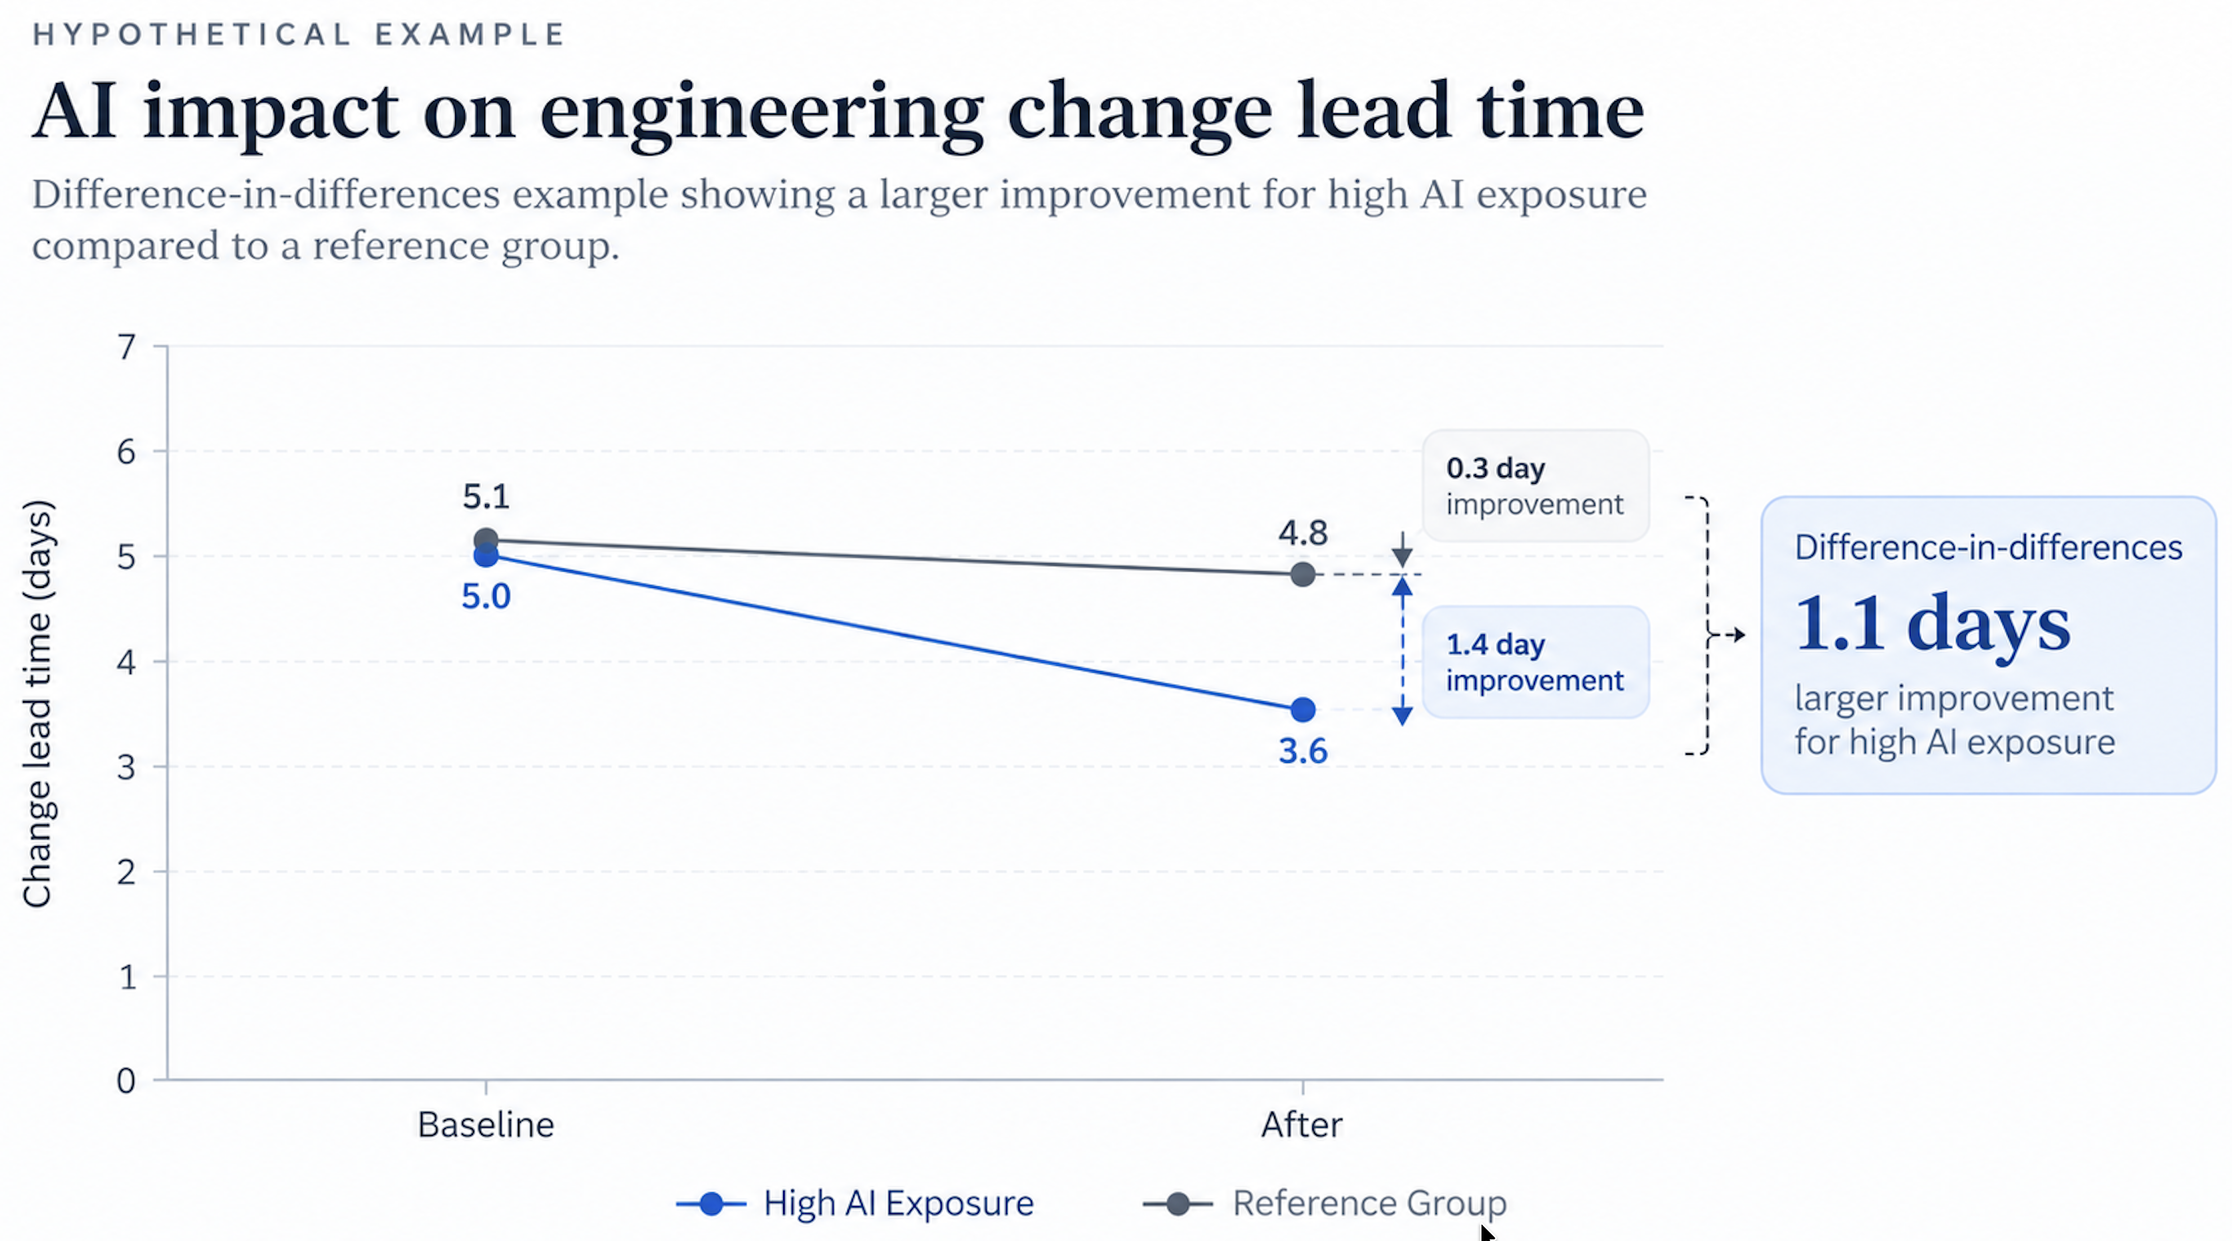
That is why I would compare the exposed cohort's change against the change in a reference group over the same period. The logic resembles a difference-in-differences approach.
Hypothetical example: before rollout, the high-exposure cohort's median change lead time was 5.0 days. Afterward, it fell to 3.6 days: an improvement of 1.4 days. Over the same period, a comparable group moved from 5.1 to 4.8 days: an improvement of 0.3 days. The difference between the two changes is approximately 1.1 days. That number is more informative than attributing the entire 1.4-day drop to AI.
I would still avoid calling that value a causal effect without examining the complete design. Difference-in-differences depends, among other things, on comparable groups and a plausible assumption that trends would have evolved similarly without the intervention. The example shows why a temporal reference helps separate out part of the movement already underway.
 Enlarge ↗
Contextual factors need to appear in the analysis#
The main risk in a cohort comparison is constructing groups that were already different before adoption. Intensive users tend to be early adopters, may be more familiar with the tool, or work in teams with greater technical maturity. If their results are better, the difference cannot automatically be attributed to AI.
I would record at least seniority, domain, task class, application maturity, pipeline maturity, team composition, and major external dependencies. The calendar matters too: freezes, incidents, migrations, quarter-end, and major releases change delivery metrics.
Aggregation can hide another problem. If adoption is higher in new services while legacy systems concentrate approvals and dependencies, the consolidated view may suggest an effect that almost disappears when we compare similar applications. I would therefore segment before concluding.
The observation period needs to cover enough cycles that a single release or incident does not determine the result. For duration metrics, I would examine distributions and medians. For DevEx surveys, I would track sample size, response rate, and cohort trends, without treating small fluctuations as strong evidence.
The dashboard does not need a productivity score#
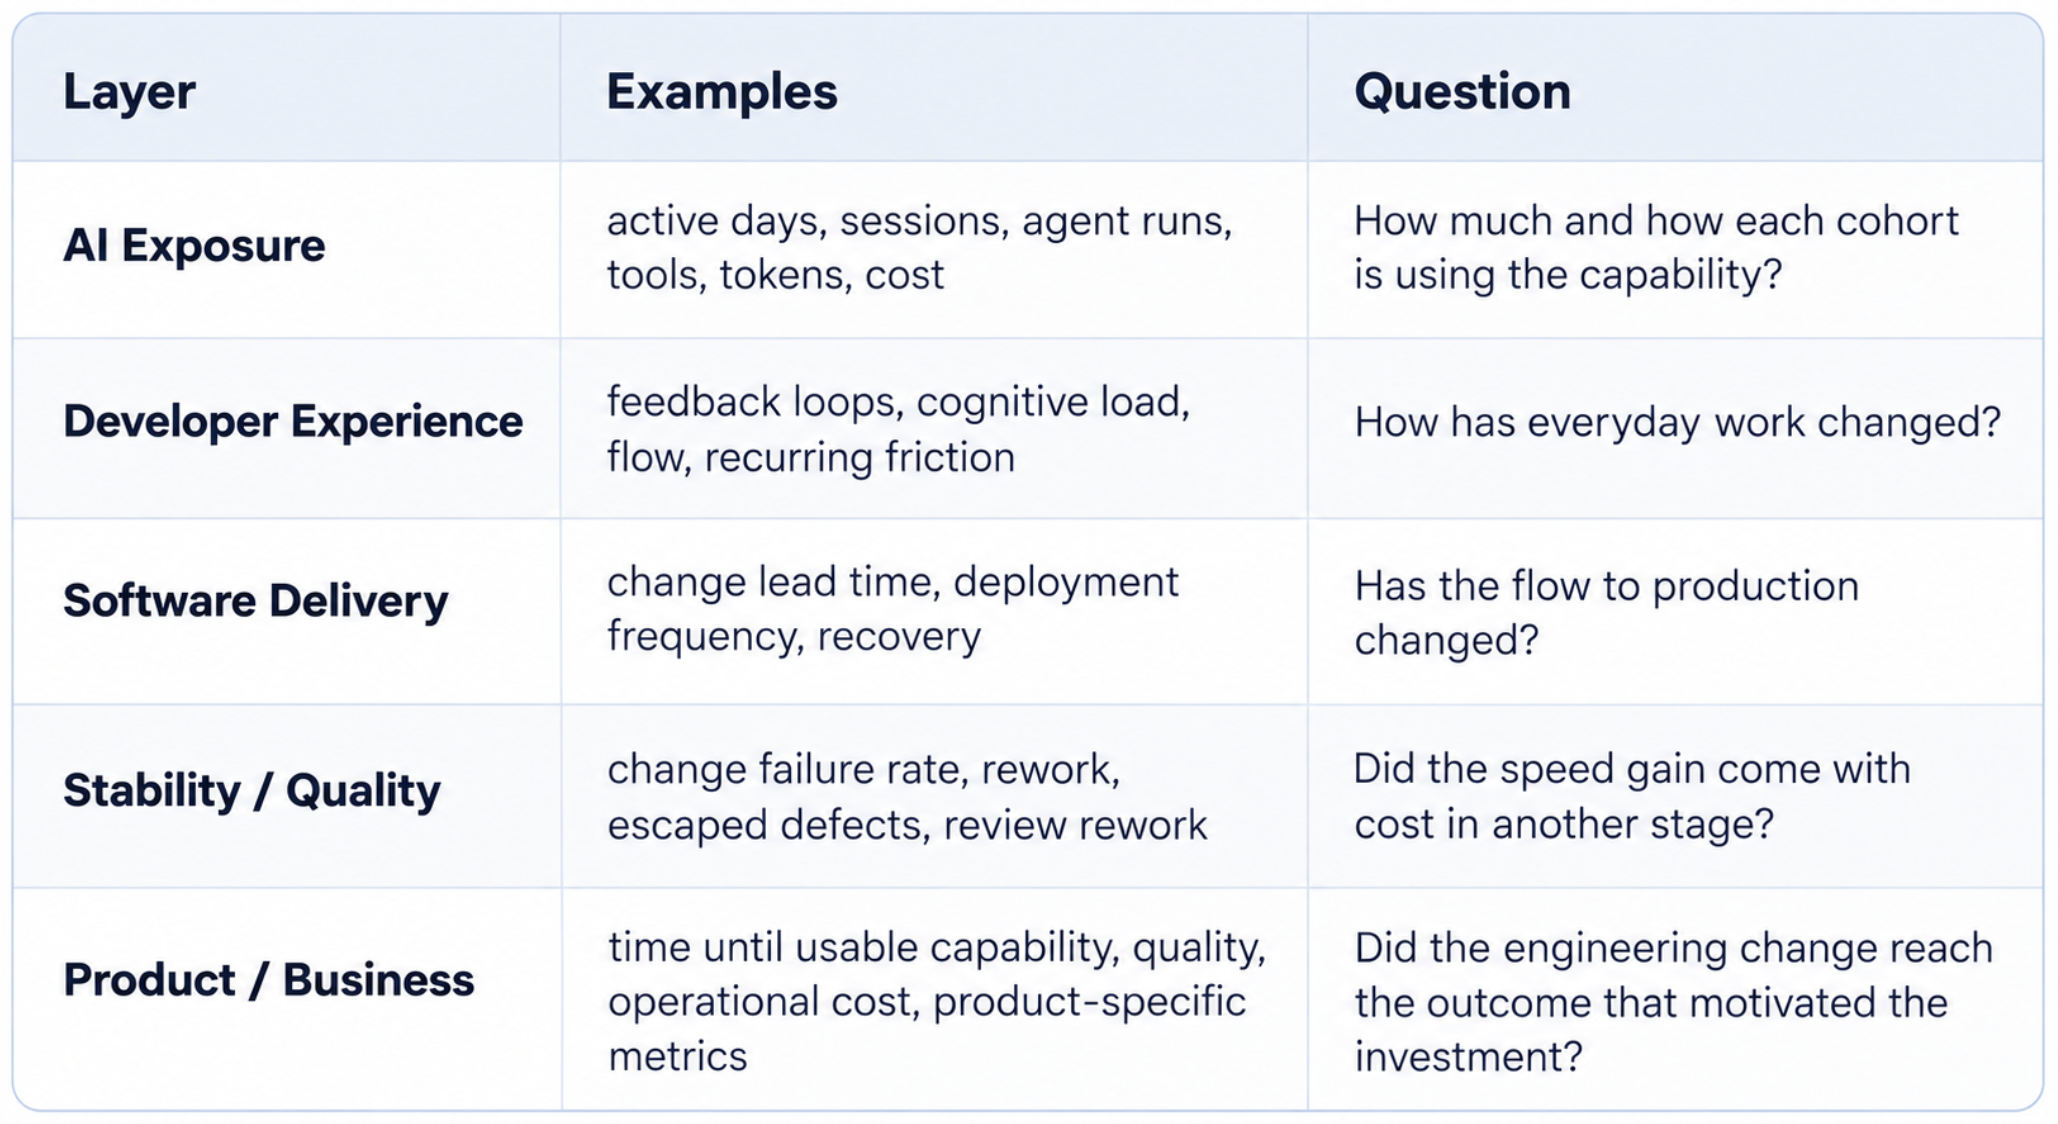
I would keep metrics in layers and allow navigation between them, without trying to condense everything into a single number.
 Enlarge ↗
That final layer needs to be specific. A platform team might observe onboarding time; a banking application might track time to make a capability available, post-release defects, or operating cost; another product might have a completely different outcome. Standardizing the business metric across the whole company would probably oversimplify the analysis.
How I would run the pilot#
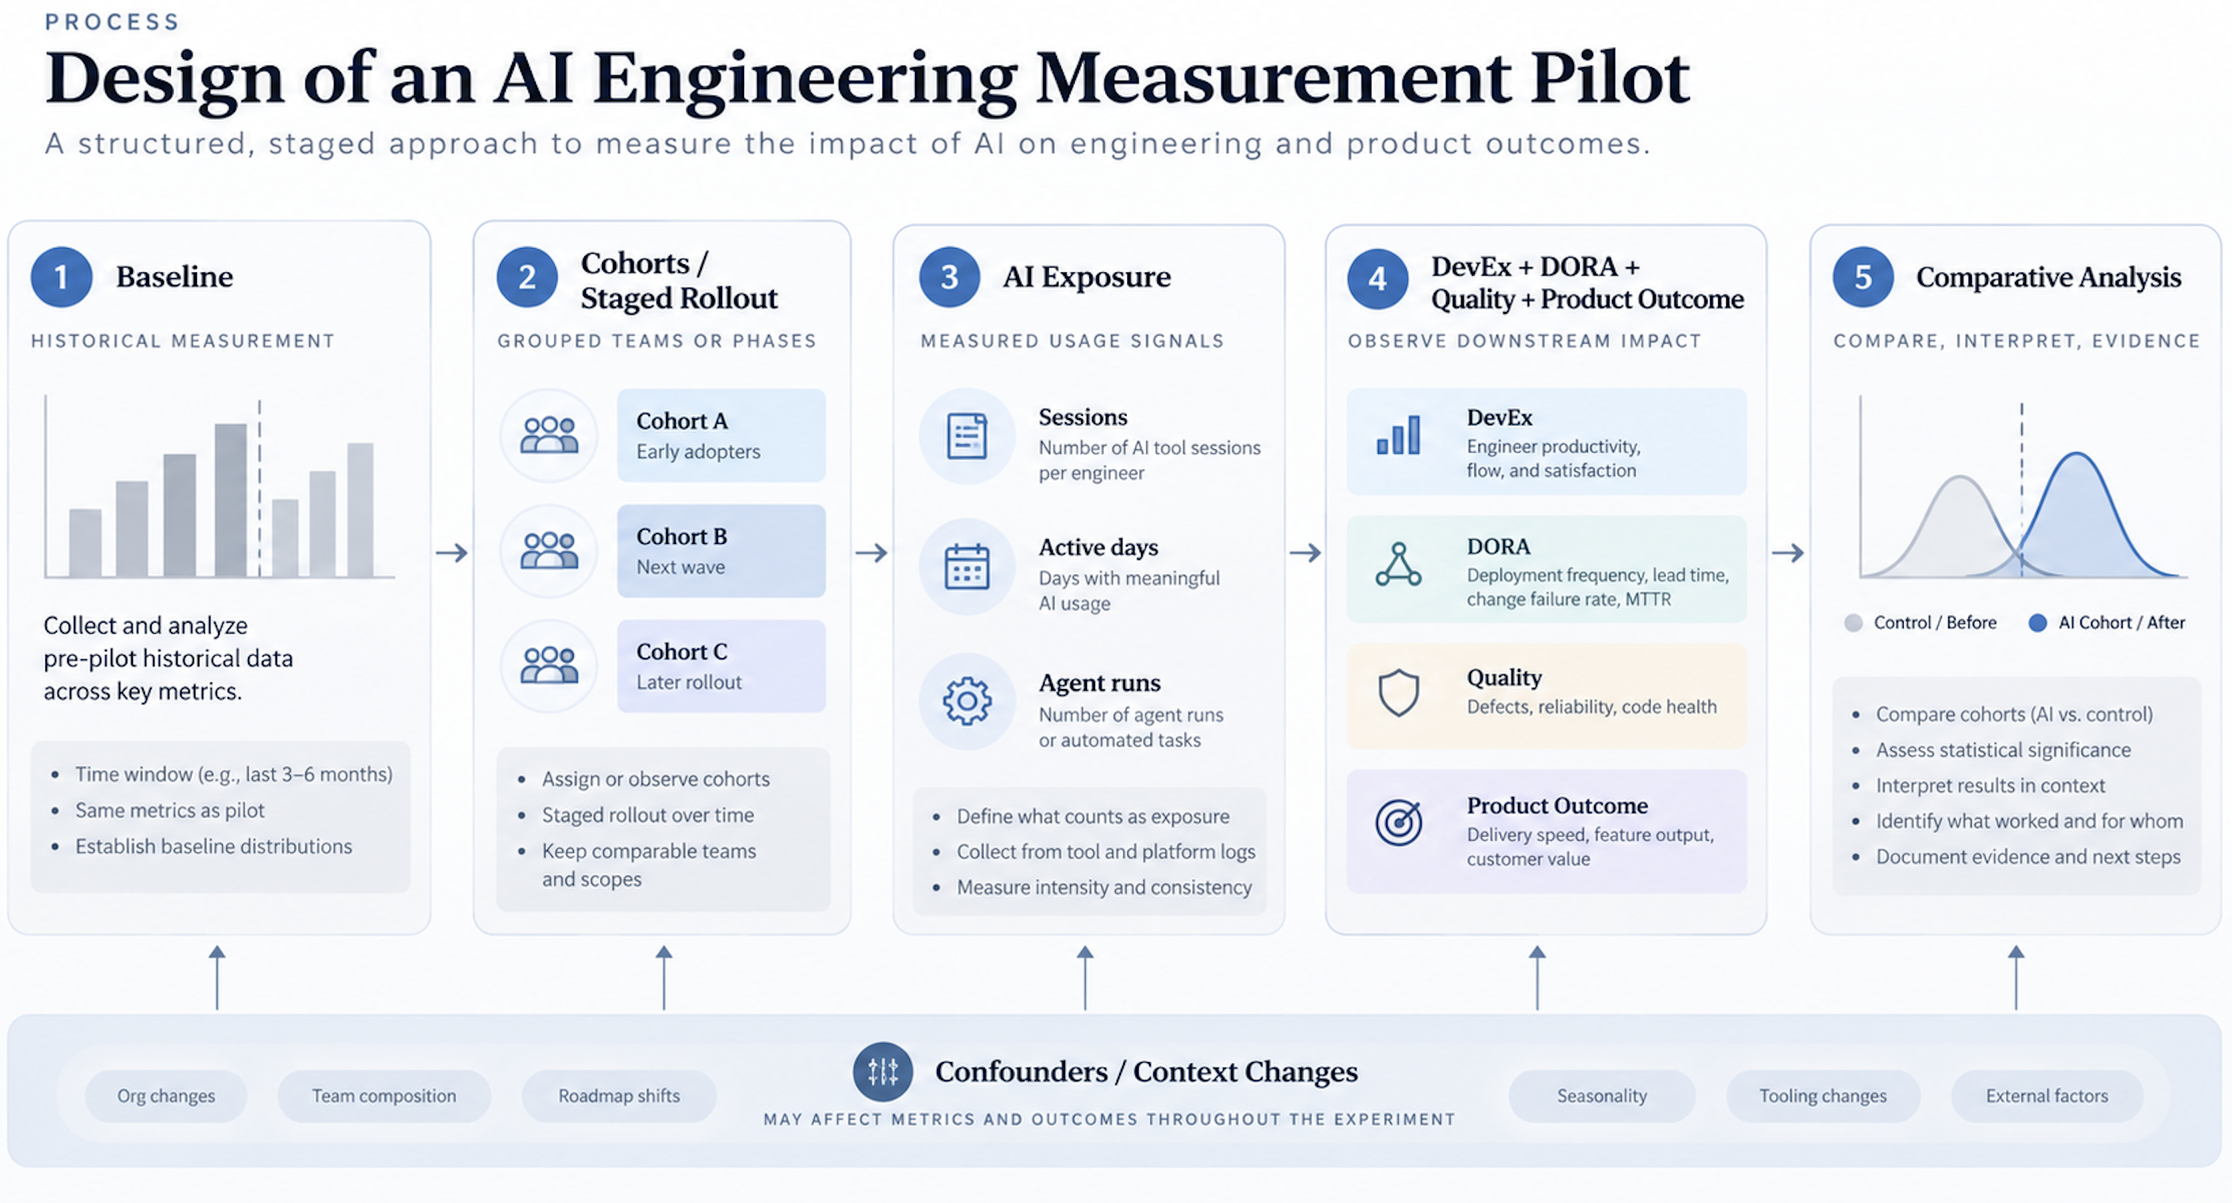
I would begin with a few teams or services that were genuinely comparable. Before rollout, I would define the hypothesis, unit of analysis, and metrics, avoiding selecting them after seeing the result. I would also collect enough baseline data to cover more than one delivery cycle.
Usage conditions must be recorded. The model, tool, harness version, available tools, and significant changes to the environment should accompany the data. If the platform changes midway through the pilot, that change becomes part of the interpretation.
During rollout, I would keep usage telemetry separate from outcomes. The analysis would be by cohort and period, recording important external changes: a pipeline change, team reorganization, release freeze, migration, or significant incident.
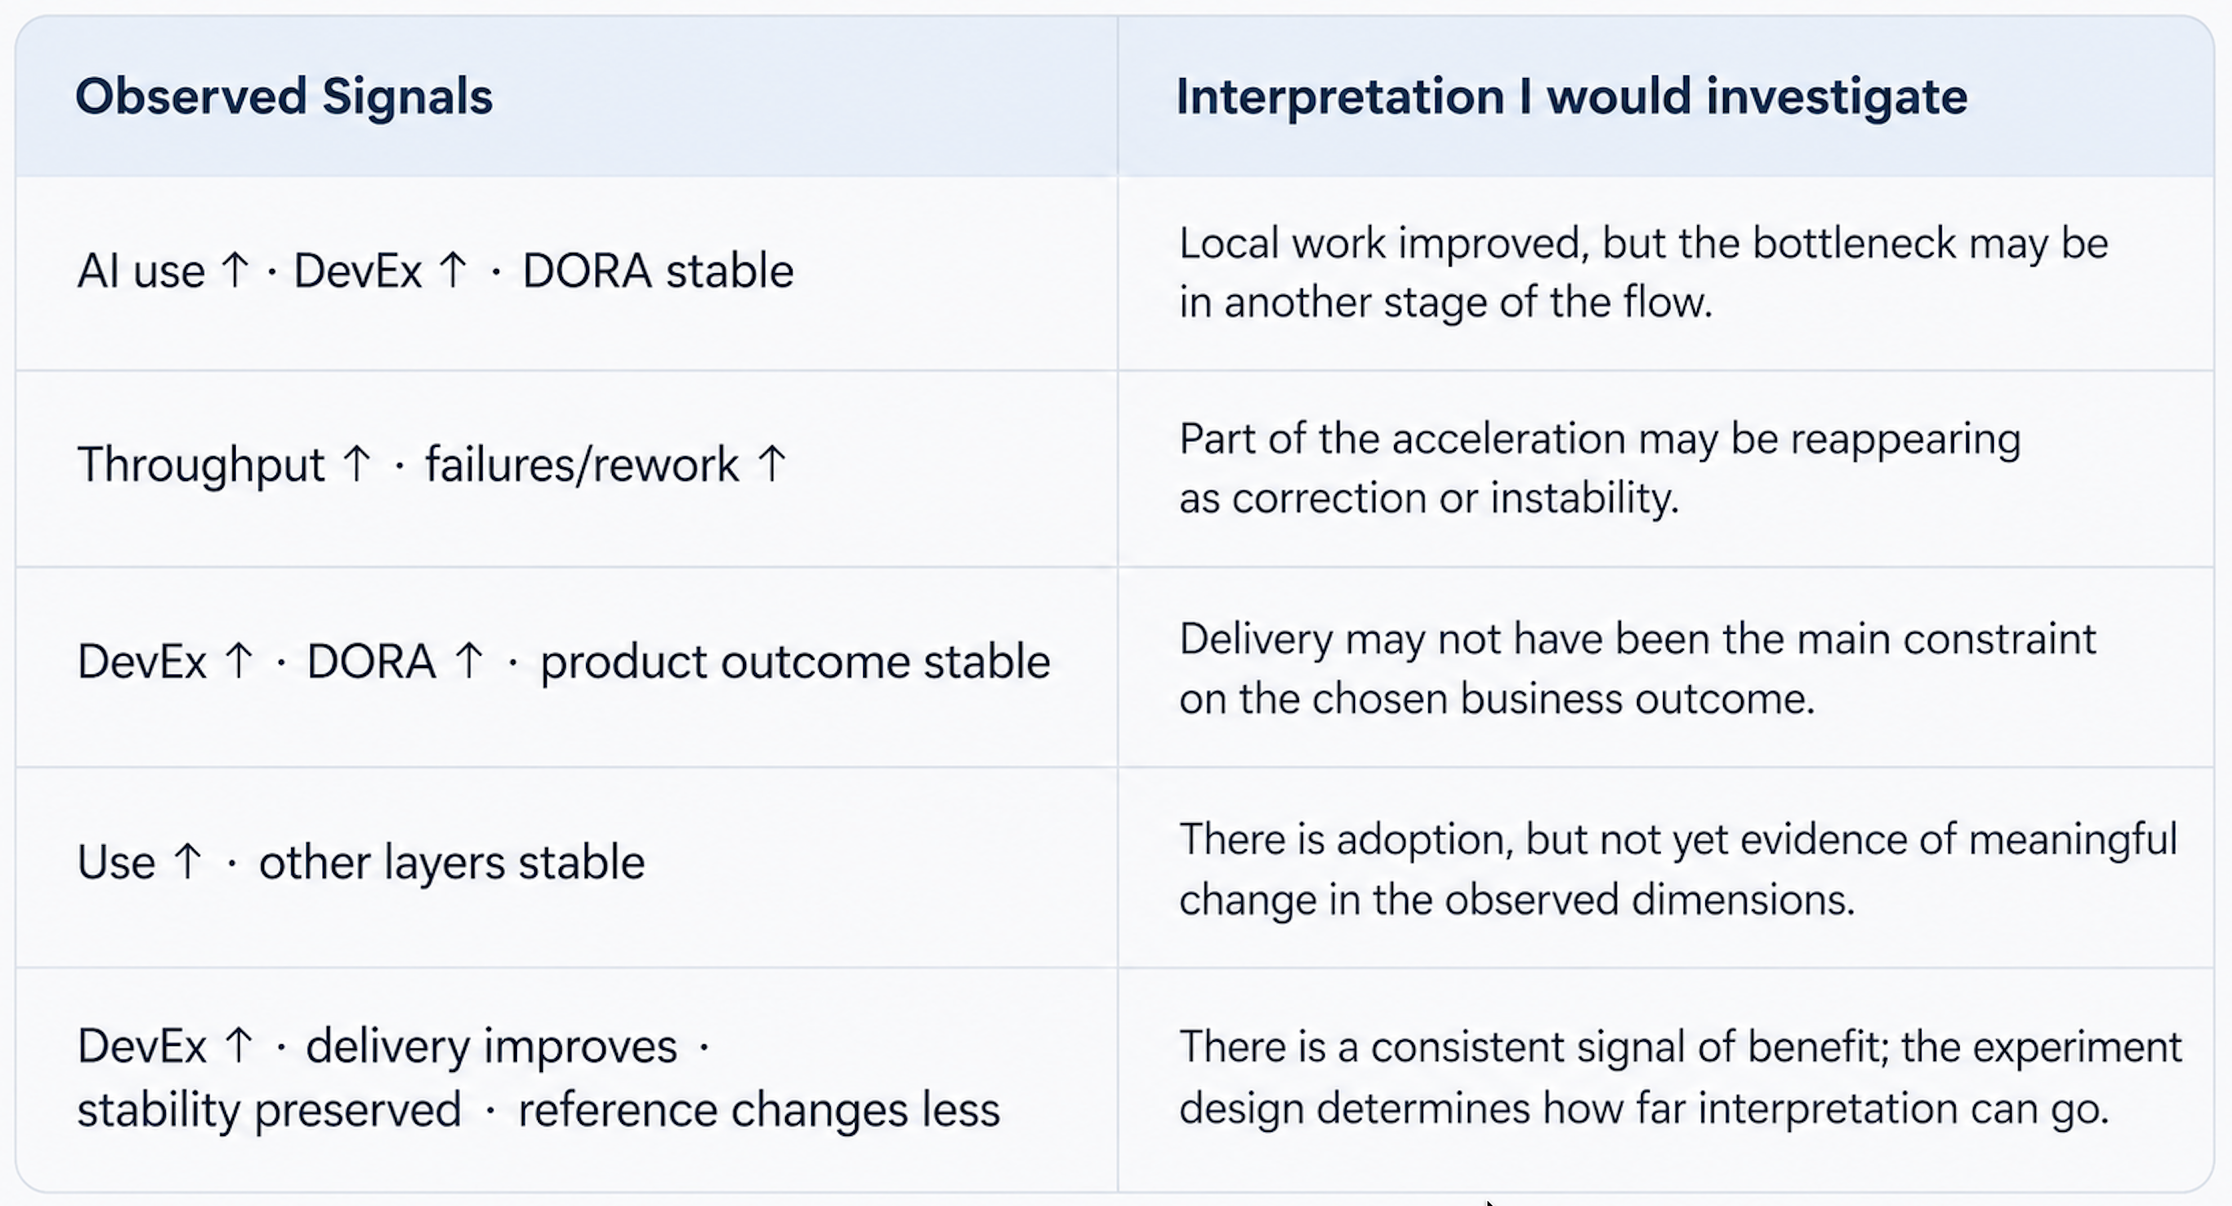
At the end, I would look for consistency across layers. Improved Developer Experience alongside shorter change lead time and similar stability is more interesting evidence than any of those metrics alone. If only tokens increased, we know there was usage. If only the time to produce the first version fell, we know one local step accelerated. If change appears in DevEx, delivery, and quality, and also differs from a reference, the hypothesis gains support.
 Enlarge ↗
Some combinations are more informative than an isolated metric#
 Enlarge ↗
This kind of interpretation helps avoid a common conclusion in AI programs: taking the first metric that moves and turning it into proof of ROI. Sometimes the most useful pilot result is discovering where the acceleration stopped propagating.
I would not use the experiment to rank people#
These metrics serve to evaluate a change in the engineering system. Turning them into individual evaluations would change incentives and contaminate the measurement itself. Tokens can be maximized, PRs can be fragmented, deployments can become targets, and surveys stop being a good source when honest answers carry personal consequences.
I would also avoid creating an “AI productivity score” by adding together usage, DORA, DevEx, and outcomes. A single number is easy to present and difficult to interpret. Deteriorating stability could disappear inside the score, offset by more sessions or deployments, precisely the trade-off we want to see.
What a useful conclusion looks like#
I would not expect to finish the pilot with a statement such as “AI increased productivity by 27%”. The conclusion that would interest me would be more specific: in certain teams, applications, and task classes, greater exposure to a well-defined capability was associated with measurable changes in some dimensions of work and delivery, within the limitations of that design.
That is less convenient for a slogan but far more useful for investment decisions. It helps identify where to expand rollout, where the platform needs to change, which types of work respond better, and which constraints continue to limit the system.
This is also where the two parts of this series meet. AI telemetry describes usage, cost, and exposure. Developer Experience shows how work changed. DORA helps observe whether that change reached the delivery flow. Quality and stability show whether costs shifted elsewhere. Cohorts and baseline put change into perspective. The product outcome closes the analysis when there is a clear relationship to what the organization intended to improve.